Keiko Nomura, PhD

My personal website
Demo: Raster and Vector viewers
LinkedIn (most used)
BlueSky (relatively active)
FAQ
Frequently Asked Questions about our paper and FREL/FRL
Question 1: What is FREL/FRL? What does it have to do with REDD+?
Answer: In order to reduce emissions from forests, you need to know the level of emissions you are reducing from. This benchmark emissions are Forest Reference Emission Levels (FREL) or Forest Reference Levels (FRL).

Question 2: What is the difference between FREL and FRL?
Answer: FREL is the level of emissions from REDD of REDD+ (keep trees standing), but FRL includes removal of emissions (+ of REDD+, like planting new trees, to put it simply). You can find more information about FREL/FRL here.
Question 3: There are so many REDD+ projects out there. How did you choose which one to look at?
Answer: The number of REDD+ is limited and finite if we are talking about REDD+ at the national level, meaning one per country, with the exception of Brazil, which has two (Amazonia and Cerrado). Then why are there so many REDD+ projects? This is because anyone can use the word "REDD+" in naming a project without any process of verification that the project aims to reduce and remove emissions from forests. As more awareness was raised about the relationship between climate change and forests, which can be used to secure more funding to existing projects in the forestry, "REDD+" was often used to communicate that relationship and the importance of their project rather than to actually mean that the project aims to reduce or remove emissions from forests.
Having said that, there are REDD+ at the project level. It's fairly easy to distinguish them, because the project probably has emission information, monitoring and verification, safeguarding against leakage or displacement, etc.
Question 4: I work for a government. How can I use the Global Forest Change (GFC) data to check deforestation? We do not include plantations and also have a specific definition of forests (e.g. minimum area and canopy cover).
Answer: If you work for a government, you probably have geographical information about your forests, excluding or including certain plantations or other non-forest land use (e.g. settlements). You can use that information as a shapefile to process GFC data. You can also draw a polygon of the area by hand for a quick analysis using a free and open source GIS software.
Global Forest Watch recently released a plantations map. You can use their shapefile to process the data. Below is an example of finding a shapefile from GFW.

Below is a step-by-step example:
Step 1
Go to https://bitbucket.org/nkeikon/erl/
Click 'Source' and 'process_gfw.py'
Step 2
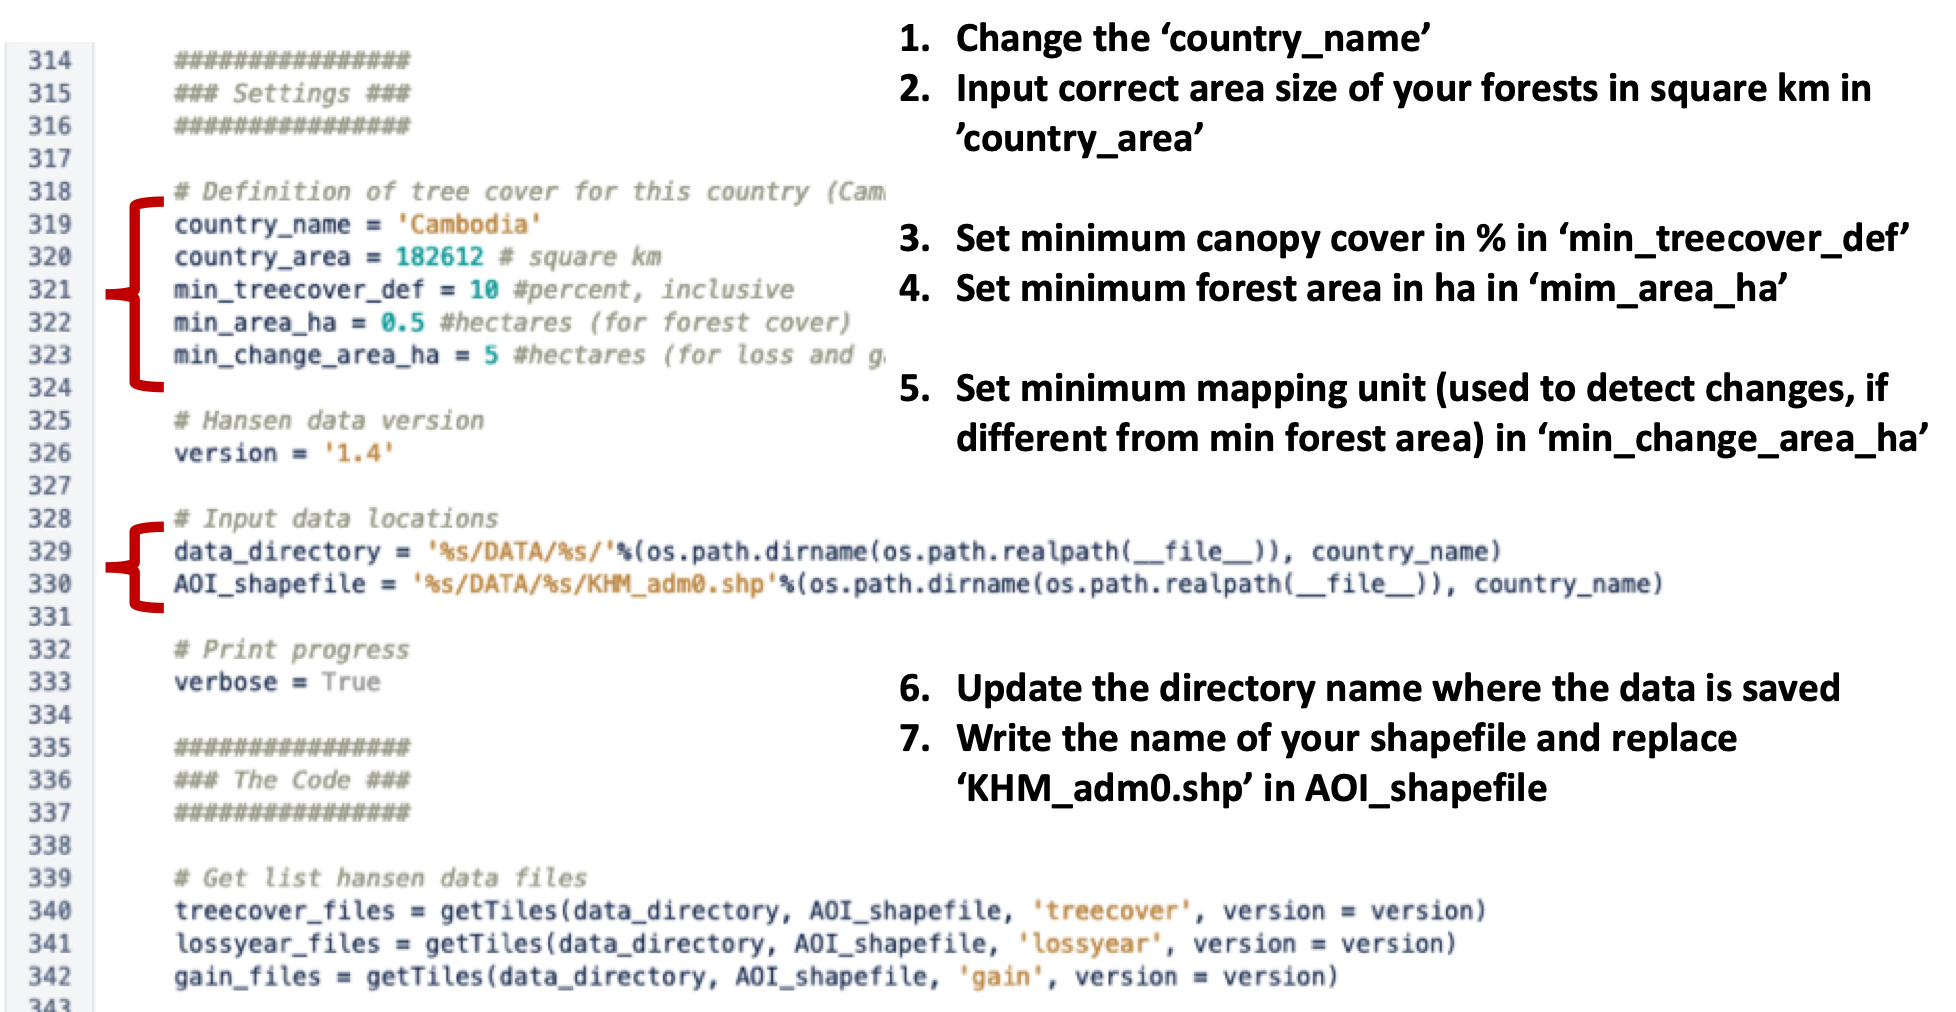
Scroll down to line 314

Step 3
Set parameters and file
Alternatively you can use Google Earth Engine to estimate forest cover and loss.
Question 5: Why does the GFC data include plantations?
Answer: Any data derived from remote sensing uses photosynthetic activities in vegetation to detect their location. They don't discriminate trees based on the land use class we assign. Isn't it unreasoble to assume that trees know what their purpose is for humans? ;)
More discussions about plantation areas and the GFC data for our analysis are in the second paragraph of Section 3.1.3.Question 6: Your analysis included all trees in all areas. Are the results relevant to conservation?
Answer: Yes, because we looked at the changes and the trends in the long term. We are not simply comparing the data from GFC and from FREL/FREL and saying that they are different. Of course they are different. Not all areas with trees are forests.
However, when you see consistent differences in the trend of forest change between two data, over a long period of time, it indicates a risk that vulnerable forests are located outside of the planned areas or the government's definition of "forests".