Keiko Nomura, PhD
My personal website
Demo: Raster and Vector viewers
LinkedIn (most used)
BlueSky (relatively active)
Oil palm in Myanmar
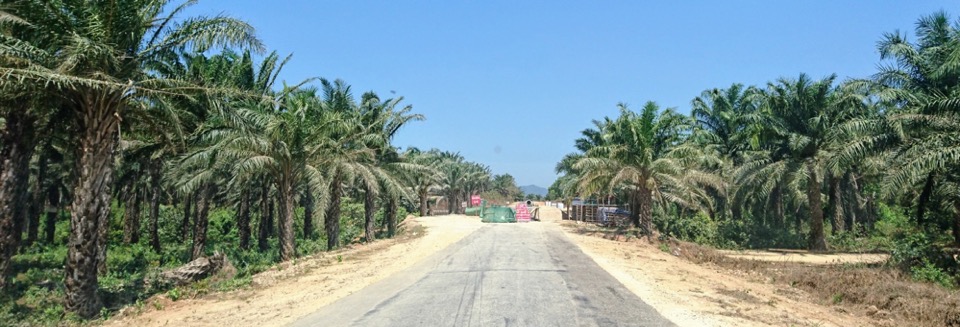
Land-Use Change, Forests, and Oil Palm Concessions in Southern Myanmar
Myanmar had the third largest area of forest loss in the world from 1990 to 2015, with the forest cover declining from 39.2 million hectares to 29 million hectares (FAO, 2015). While the country lacks accurate data on deforestation, forest degradation and forest carbon stocks, the increase of agricultural area and temporary cropped area matches the forest area decline of about 7.7 million ha between 1990 and 2011 (Raitzer etal., 2015). Among several agribusiness concessions, oil palm plantations have increased by 900% since 2000. These are located in the Tanintharyi Region of Southern Myanmar. As of 2015, 402,000 hectares have been allocated for oil palm development, of which less than 40% has so far been planted (Baskett, 2016).
![[Myanmar seed]](myanmar.jpg "Myanmar seed (early stage)") |
In March 2018, the Myanmar government announced a plan to revoke unplanted areas of oil palm concessions owned by several companies. Most of them are owned by foreign companies and have conflicts with villagers. Could concession areas with conflicts with villagers, elephants and the forest department prevent clearance?
Methods
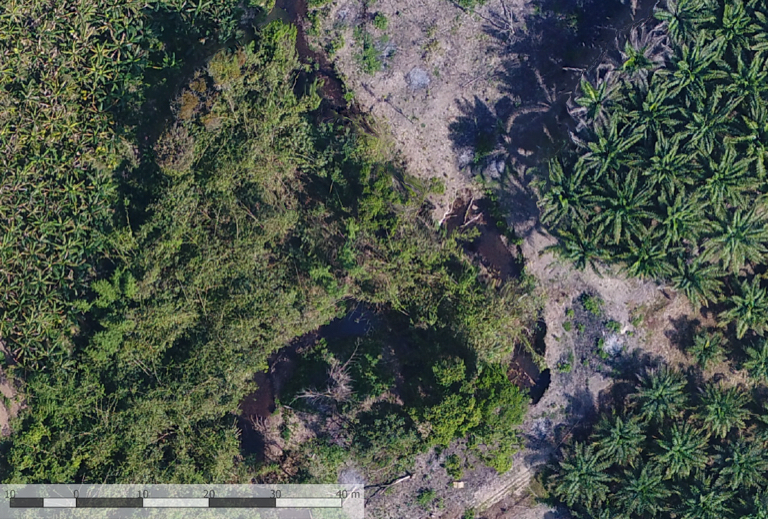
![[UAV and Sentinel-2]](fuse.jpg)
Example of the features visible at different resolutions: individual palm oil trees can be easily distinguished in the UAV data, but their presence in the Sentinel-2 data can only be inferred based on spectral and temporal characteristics of a dense time series of data.
Optical data from unmanned aerial vehicles (UAVs) and Worldview-3 are used to assess the canopy cover and deforestation in and around several oil palm plantations from 2017 to 2018. These data can identify even young palm trees, and therefore allows an assessment of degradation rates in all different land use types in the area. These then provide the basic data that can be used in combination with other spatial representation of drivers (e.g. distance to roads) to identify the characteristics of the area and its drivers of tree loss. The percentage of canopy cover and the expansion of plantations are derived by generating random 100x100m grids and summing which of the 121 points within the grid have trees present. In the figure below on the right, palm trees are circled in red and other trees are in white.
 |
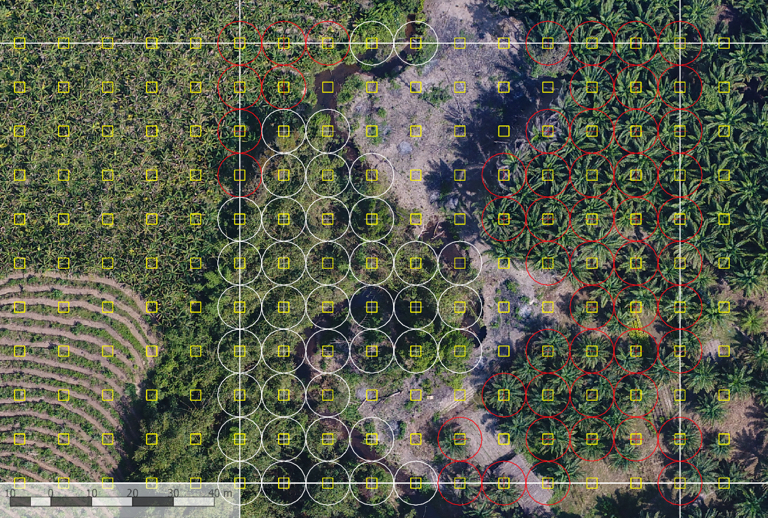 |
| UAV image | Dot-grid method |
![[Sentinel-2 Timelapse]](S2time.gif "Sentinel-2 monthly median composites") |
![[Landsat Timelapse]](bare.gif "Bare land from 2017 to 2018") |
| Sentinel-2 monthly median composites (2015-2018) | Bare land (black) change from 2017 to 2018 |
References
Baskett, J. P. C. (2016). Myanmar oil palm plantations: A productivity and sustainability review. Fauna & Flora International.
FAO (2015). Global Forest Resources Assessment 2015. How have the world's forests changed? Rome, Italy.
Raitzer, D., Samson, J. N., & Nam, K. Y. (2015). Achieving Environmental Sustainability in Myanmar. Asian Development Bank Economics Working Paper Series, (467).